
It’s now three weeks since the US Presidential Election and most of the networks have finally called all of the states, even if the incumbent President remains reluctant to officially admit defeat.


Nevertheless, Joe Biden is the 46th President of the United States. Four years ago the polls were famously wrong. In the interim, a lot of work has gone into improving election polling and forecasts. It seems this year the polls were wrong again. Although perhaps wrong in a different way.
Interhacktives looked at four of the most searched for election models to see who came out on top.
Predictions recorded on the morning of election day.


It’s pretty difficult looking at electoral college votes to say any one model was better than the others. The New Statesman was closest. But all the models overestimated Biden and underestimated Trump.
However, if we look at the confidence intervals for two of the models that provided data we see that the result was well within what the model predicted.
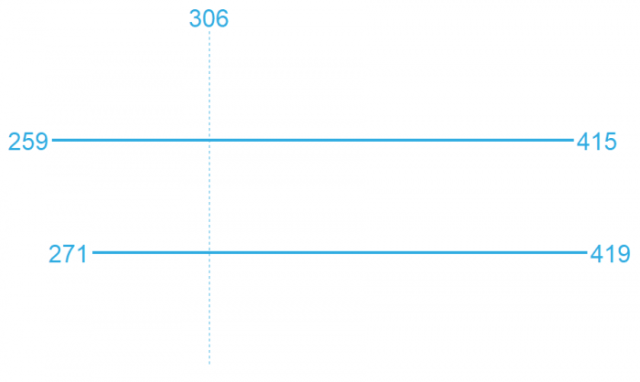
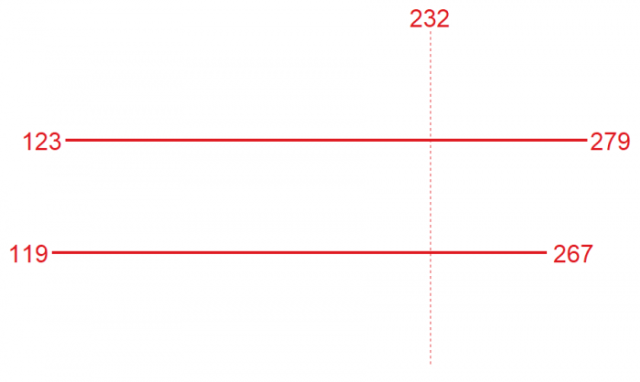
The issues with the polling and modelling this election are not just the predictions themselves. All of our four forecasts got the result within their margin of error. But rather it’s a matter of how journalists communicate uncertainty.
In lots of journalistic pieces, and even in official statistics, the measure of uncertainty is given as a footnote. In two of the models we looked at the confidence intervals weren’t even given.
So if journalists and forecasters are to regain trust in their predictions then they need to make clear what a statistical prediction really is: a midpoint within an interval. Statistics is all about measuring uncertainty, it shouldn’t be an embarrassing footnote.
What is a confidence interval?
Most statistical estimates are given with what is called a confidence interval. It would be reasonable to assume a confidence interval is a degree of certainty that the predicted value will fall within this range. And this is where the misunderstanding of uncertainty arises.
Confidence intervals aren’t a range of possible results rather a statistical likelihood of a prediction falling within a certain interval. For example, if we were to say Biden will win 350 electoral college votes with a 95% confidence interval of 340-360 then we are saying if we were to predict this interval an infinite number of times then 95% of those intervals will contain the true value. So it’s important to think of the prediction of 350 and the confidence interval of 340-360 as two linked yet separate statistics.
The reward of making a precise prediction that turns out accurate is great, but the risks for the industry when we’re wrong or misinterpreted are significant. What the US election results really tell journalists are that if readers are going to trust our analysis and predictions we need to be transparent about what we don’t know. And in representing statistics that means being upfront about uncertainty.