
If you’re interested in dataviz, you’ve probably been hearing a whole bunch about D3. When you stumble across a really creative-looking visualisation, chances are it’ll have been made with D3.
Yes, it’s hyped, and there are a million tutorials out there and it can all feel a little overwhelming. So where to start?
Luckily, your humble Interhacktive test bunny has taken the plunge, and tried out three ways of learning to use D3. Read on, for the pros and cons of each.
What is D3?
It’s a powerful Javascript library developed by Mike Bostock. D3 stands for “data-driven documents”, which basically means that you’re binding the data you want to visualise to DOM elements and manipulating them.

All of which sounds really technical, of course. The short answer is that D3 lets you make beautiful custom visualisations, entirely from scratch.
When should I learn it?
You’re getting the hang of out-of-the-box vis tools like Plotly, Datawrapper and CartoDB, and are starting to feel frustrated by their limitations. You want to have more freedom to make visualisations that look exactly the way you want.
I’ve heard it’s insanely complicated. Should I be worried?
The honest answer? Yes – D3 does have a rather steep learning curve. I felt quietly panicked the first time I read through a tutorial, and you may feel a little bit discouraged at first too, depending on your background.

You will be writing Javascript, and yes, you will be writing hundreds of lines of code. You’ll want to be somewhat familiar with HTML, CSS, SVG and DOM elements (if any of this sounds scary, don’t worry! Start with Codecademy’s HTML and CSS tutorial).
BUT: You hardly need to be a Javascript expert before you can start learning D3. In fact, lots of people have said that D3 is a great way to get a feel for Javascript in the first place.
Okay, I’m in. How do I get started?
There are roughly speaking a bazillion tutorials – just on Mike Bostock’s GitHub page. Where to turn? I’ve trawled through a whole bunch of them and am back to report on the three I found most useful.
Video tutorials
Ah, Youtube. Reliable source of how-to videos from how best to groom your cat to how to dance salsa. Naturally it’s also happy to instruct you on how to visualise your data. I followed user D3Vienno’s 20 video tutorials, and found his explanations of some of D3’s more bizarre functions rather good.
20 videos sounds like a lot to get through, but they’re easy to follow and he’s managed to fit in a lot of information. By the time you get to the 20th, you’ll have covered ground from very introductory principles up to advanced D3 layouts like tree maps and geomapping.
Pros
D3Vienno is a journalist, which makes his tutorials particularly useful to fellow hacks.
Cons
The tutorials get off to quite a slow start, so if you have any previous experience of Javascript, you may start to feel restless.
Book: Interactive Data Visualisation for The Web
Scott Murray’s book on D3 is a bit of a classic. It’s also surprisingly funny (probably as funny as a book on programming is likely to get).
This hefty tome is intended for absolute beginners and will hold your hand as it guides you from the very basics – like what HTML really is.
Pros
Murray’s exercises are easy to follow. And like I said, he’ll make you giggle a bit.
Cons
I didn’t feel afterward that I’d got a whole lot of independent skill. When working through the tutorials I thought that I’d got it all, but when I tried my hand at creating my own viz afterward, I drew a blank. I’d suggest combining the book with some video tutorials.
Go to a workshop!
I was lucky enough to attend a D3 workshop in London run by Peter Cook of AnimatedData, where attendees range from visual journalists to Python developers and Javascript beginners (yours truly).
Cook really goes through the fundamentals. If you’re coming expecting to have made some crazily advanced force network by the afternoon, you’ll be disappointed. By hometime, I had created a scatterplot that I could’ve charted in Excel. BUT: More importantly, he’s talked us through the philosophy behind D3.
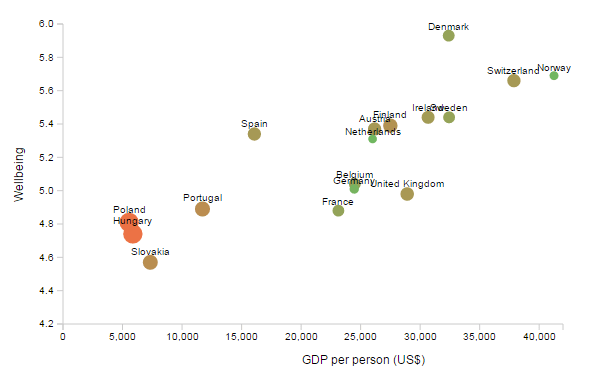
When simply following tutorials, you’ll often find yourself typing in strange commands like enter() and exit() without really understanding why they’re doing whatever it is they’re doing.
Attending a session with a professional like Cook takes you through the steep initial learning curve with a firm understanding of the fundamentals.
We also deconstructed how breath-taking visualisations like this one by the New York Times were made.
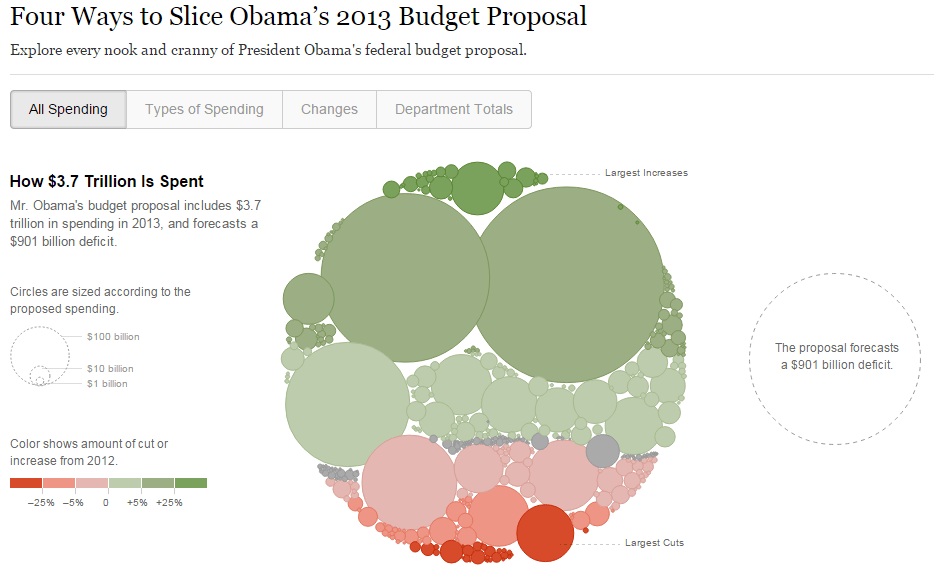
“This bridges the gap between what you know now and what’s necessary to do these advanced visualisations,” Cook said.
Pros
Having a chance to ask any stupid questions really gives you a better grasp of how D3 works.
Cons
The cost…(up to £250, to be exact).
So what’s the verdict?
Going to a workshop is fantastic, but has the obvious drawback of being expensive. Still, there really is no good replacement for having someone knowledgeable taking you through it in person. If you’re broke, try to find someone who’ll be your D3 mentor so you can turn to them for questions. Why not join a Meetup?
Is there any reason not to learn D3?
If you really hate coding, maybe give it a rest for now. There are a lot of other cool tools that you can use to make visualisations without writing a line of code.
But if you learn a little bit – even if you can’t do particularly advanced things on your own – you will know enough to have an easier time cooperating with any developers or journocoders you’re working with. That’ll help you know if and when demands that you’re making are unreasonable, and give you an idea of what takes how long. It will make you popular with all the developers and the world a generally happier place.

Clara has fled the arctic wilderness of Sweden to be a data journalist in London. She likes strong coffee, data-driven storytelling and really massive spreadsheets.