
A veritable giant of data journalism, Simon Rogers launched the Guardian’s Datablog in 2011 before moving over to Twitter where he now manages the site’s vast quantities of data. We asked him about the perils of data journalism’s popularity and where it’s all headed.
Twitter has an unbelievable amount of data – what do you with it all?
It’s a lot of data — around 500 m Tweets a day. What we try to do is tell stories with it, much of which entails making it smaller and more manageable, to filter out the noise that we don’t need. People Tweet how they think and how they behave — the data can show you amazing patterns in the way we respond as humans to events as they happen. When a story breaks somewhere, or a goal is scored or a song is performed, you can discern these ripples across Twitter. It’s getting those ripples out of the data that is the challenge.
What’s the day-to-day like as data editor at Twitter?
It is such a mix and each day brings its own surprises and challenges. At one end of the spectrum I use free tools such as Datawrapper or CartoDB to make maps and charts that respond to breaking news stories or events, such as this one on the spread of Beyonce’s new album or the discussion around events in the Ukraine or the conversation around #Sochi2014. At the other end of the spectrum, I get to work with the data scientists on Twitter’s visual insights team to produce things like this interactive guide to the State of the Union speech or this photogrid of the Oscars, which is essentially a treemap with pictures. Right now we’re thinking ahead to things like the World Cup and the US Midterm Elections to answer the question: how can we use Twitter data to help tell the stories that matter?

Are you still a journalist?
I’ve wanted to be a journalist since the age of eight and it’s completely in my DNA. Over that time the idea of what was or wasn’t a journalist has completely changed. When I started the Datablog at the Guardian, people asked if data journalism was really journalism at all to which my response was: who cares? My feeling is that you just get on with it and let someone else worry about the definitions. My job is to tell stories and make information more accessible to people. I take Adrian Holovaty’s approach to this:
1. Who cares?
2. I hope my competitors waste their time arguing about this as long as possible.
What do you think about the Guardian’s Datablog since you left?
The Datablog was my baby and always will be special to me but I have to let it go and not interfere, so that’s what I’m going to do.

What drove you to found Datablog?
We had a lot of data that’s we’d collected to help the graphics team and we also saw there was a growing group of open data enthusiasts out there who were hungry for the raw information. So that’s how it started: as a way to get the data out there to the world and make is accessible.
Have you found there any difference in the attitudes towards or ideas about data journalism in the US and UK?
The differences in data journalism mirror the differences in reporting I would say. It’s a huge generalisation but I would say US data journalism tends to be about long investigations while a lot of the British reporting is aimed at shorter pieces answering questions. But there are exceptions on both sides. They come from different places: US data journalism is based in the investigative reporting of giants such as Philip Meyer; modern British data journalism was born out the of the open data movement and had at least as much to owe to a desire to free up public information as to big investigations.
Is data journalism ‘having a moment’ or are we in the midst of a very real paradigm shift?
It’s becoming mainstream and, just as in other areas of reporting, it is developing different strands and approaches. Partly because there are just so many stories in data now — and to get those stories journalists need skills and approaches they didn’t use before.
Some have said that data journalism is intellectually elitist, perhaps even already out of touch. How would you respond?
I think we are really at an interesting stage. The last few months have seen a lot of reporting resources put into data journalism, certainly in the US. I think what’s happening is that it is developing different strains — in the same way as you have features and news reporting in traditional journalism. You have the ‘curious questions’ type of data journalism which focuses on asking about oddities; then there is the open data type of data journalism which is all about freeing up information. I’m not convinced that we have as a group got the balance correct between showing off how clever we are and making the data accessible and open. That last part is what I’m interested in. I don’t need to see anyone showing off.
Journalists are no longer just writers, they are designers. How important are pictures, diagrams and infographics?
I speak as someone who has just worked on this range of infographic books for children. We have visual minds and telling a story effectively with images will always have a greater impact than words on a page. Some of the most detailed journalistic work I have ever done has resulted in images and graphics as opposed to long articles.
Have you seen any recent data journalism that has particularly caught your eye? And what is it that you look for in a good article/webpage?
I love the work of the WNYC data journalism team, and La Nacion’s commitment to spreading data journalism and openness in South America is amazing and really powerful.
I love maps but there are just so many of them these days. Is data journalism becoming over-saturated?
There are a lot of maps around but it’s just one visual tool. Maybe we don’t ask enough questions about which type of visualisation is most powerful and important to complement a story or feature and a map is often easiest. But also that reflects the lack of decent tools for us to use. If I want to visualise a Twitter conversation off the shelf, that often means a map or a line chart because that is what I can do easily and quickly on my own. Part of my job is to think about new ways for us to do this in future.
Do you think data journalism runs the risk of looking at the big picture at the expense of the small one?
Not being able to see the wood for the trees? The best data journalism complements the big data picture with the individual stories and story telling that brings those numbers to life. I’ve been fortunate enough to work with amazing reporters who tell very human tales and the numbers just gain so much power from joining those two elements together.
Do you have any favourite data tools – scraping, cleaning, visualising?
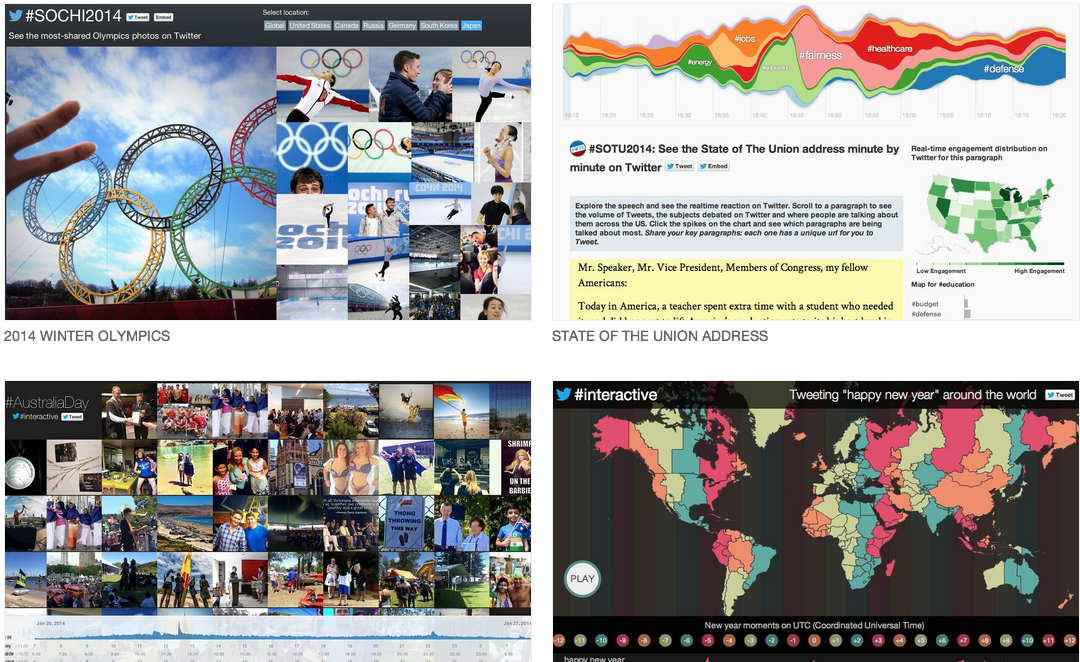
My visual tools of the moment are: CartoDB, Datawrapper, Illustrator and newly I love Raw (just discovered it).
Do you have any core principles when deciding how to express data?
I normally start off with some idea of what I’m trying to ask, otherwise the data is just too big to be manageable. Love that moment when you do the grunt work to clean up the data and it starts to tell you something meaningful.
Do you have any tips for aspiring data journalists?
The days when you could get a job in a newsroom just by knowing excel have probably gone or are going. Increasingly the data journalists who succeed will also be able to tell a story. The other piece of advice? Find something that needs doing in the newsroom — that no-one else wants to do — and be the very best in the world at doing it.
2 thoughts on “Simon Rogers interview: ‘Who cares if I’m still a journalist?’”